

One of the biggest challenges of using OKRs (Objectives and Key Results) is to define the Key Results that tell us if our objectives are on track or not. What are the leading and lagging indicators of success we hear about when talking about Key Results (KRs)?
Lagging indicators are often what you are ultimately aiming for but they are slow to move. By the time you measure change in these numbers, it may be too late to correct the course. Leading indicators are proxies for these numbers that change more quickly. They may not be the ultimate goal, but they are useful guides because they suggest you are on the right track.
Lots of teams struggle to find good Key Results for their objectives. After their first cycles they are often confronted with the question:
This happens most of the time because they are focusing only on laggingindicators. Don’t get me wrong, there is nothing wrong with lagging indicatorsand we should definitely measure and look at them. But isn’t the point of OKRs to help us align where we want to go together, focus towards a common goal and have a shared understanding about what success means? And above all, measure our progress and act accordingly?
Our Key Results should show us that we are going in the right path to achieve our goals, they should be a measure of where our business is going and possibly offer valuable insight about the future.
But can we predict the future?
As Peter Drucker said “The best way to predict the future is to create it.”.
So, how can we create our future? By asking ourselves the right questions:
These are really hard questions to answer and we won’t get it right at first. We will learn how to get better by doing it.
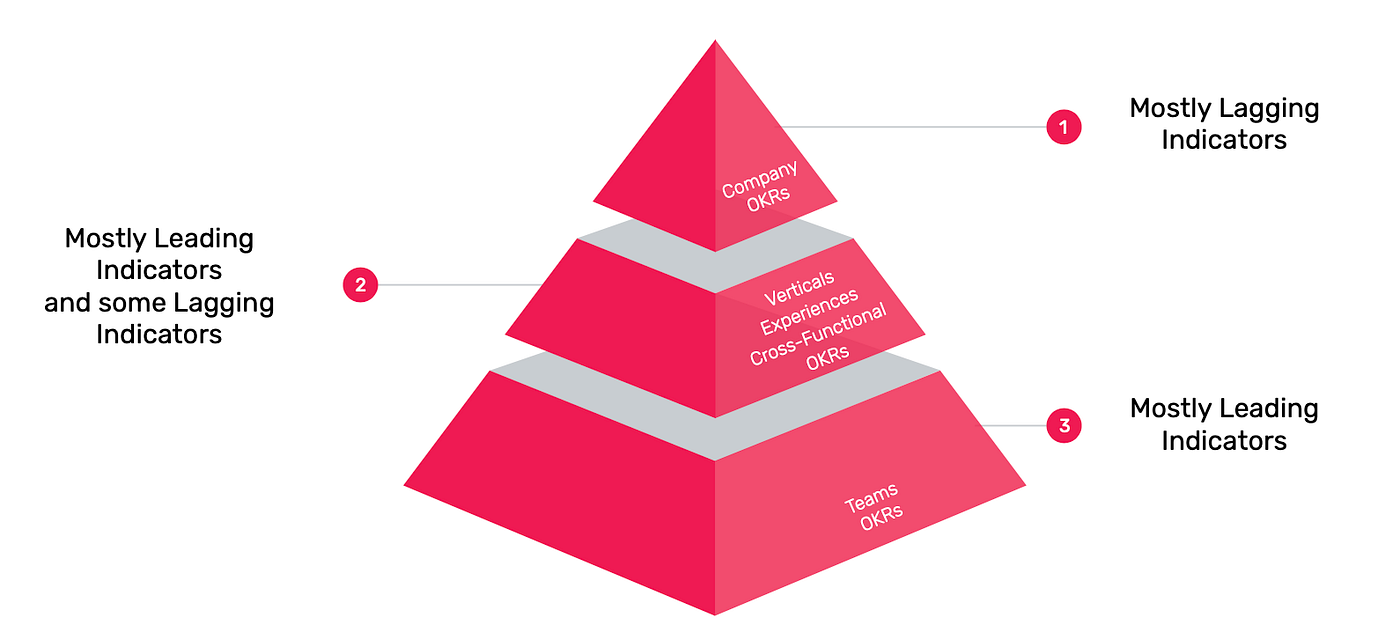
Although the idea is to shift our mindset into asking how we can focus our efforts in finding leading indicators that will make our lagging indicatorsinevitable, we should strive to find a balance of both as they inform us in different ways.
The broader we get in the OKRs, for example in the Company OKRs level the harder it will be to find leading indicators, and the deeper we get into specific teams OKRs the more the leading indicators help us in understanding if we are on the right path to success.
Let’s take a deeper look at it, generically these are metrics that inform a company or a team that it is progressing successfully towards its objectives.
Lagging Indicators are called like this because they usually lag behind the good we do. By their nature they are:
Here are some examples of lagging indicators.
Example 1
Consider a service like Netflix, lagging indicators might be churn or renewal rate. Either one of them is only measurable once the customer has made a decision to leave the service or to continue with the subscription.
Example 2
(based on Outcomes over Outputs by Josh Seiden)
Consider a shop that sells mattresses. A great lagging indicator is the number of mattresses sold. But we will only know that once customers actually buy mattresses.
Leading indicators “lead” to successfully meeting overall business objectives, which is why they are called leading. By their nature they are:
Here are some examples of leading indicators.
Example 3
Consider churn from Example 1 above, leading indicators would be numbers which point to the reasons that might lead customers to churn in the future, so we will need numbers that will help us predict churn.
A great example of those would be the Usage Rates — most of the times when a customer is about to churn they stop using the product before they actually decide to cancel the service. This gives us the opportunity to act immediately after a drop in usage happens and to think how we can influence the increase of usage so that we are given a chance to prevent churn before it happens. This way we would save the acquisition cost of getting that customer back to the service.
Example 4
Consider the mattress shop from Example 2, leading indicators would be numbers that help us predict if we are going to sell more mattresses. So what would those numbers be? For example, nobody buys a mattress without having laid down on it to experiment how it feels, so the number of people lying down on the mattresses at the store is a leading indicator we could use.
Leading indicators can also help us make decisions about how to structure a store or product to increase sellability, in this case by setting up the store to make it easier for people to lie down on the mattress for example. So they also help us identify what drives the behavior we want to get.
Leading indicators are not easy to come up with, they require us to try to predict the future. Everyone knows that predicting the future without a crystal ball is hard, so don’t expect to have it right always. A good way of finding leading indicators is also by looking back into our past successes that had a similar outcome and ask ourselves: What did we do to achieve it? How do we know it was successful? What were the criteria we used to consider it successful?And with that information try to understand if there is any way we could predict it for this case.
As a final note, leading indicators should always show us if customers are extracting value from our product, whomever our customers are.
What now?
Just go ahead and create some leading indicators for your Objectives. And remember… no indicator is perfect, it just needs to be good enough!
To finalize I would like to thank
Nuno Silva Pereira for reviewing this article and help make it better 🙂
What do you think? Feel free to clap if you liked this or comment with your thoughts!